Introduction:
Shaheen was the second most powerful tropical cyclone in the past 130 years, following the devastating tropical cyclone of 1890. It struck the coasts of the Al Batinah governorates, making the event unusual for the region’s residents.
The name “Shaheen” is an Arabic word meaning “peregrine falcon,” a type of falcon used in hunting. The name was proposed by Qatar as part of the list of cyclone names in the operational plans for cyclones in the Bay of Bengal and the Arabian Sea (WMO, 2020).
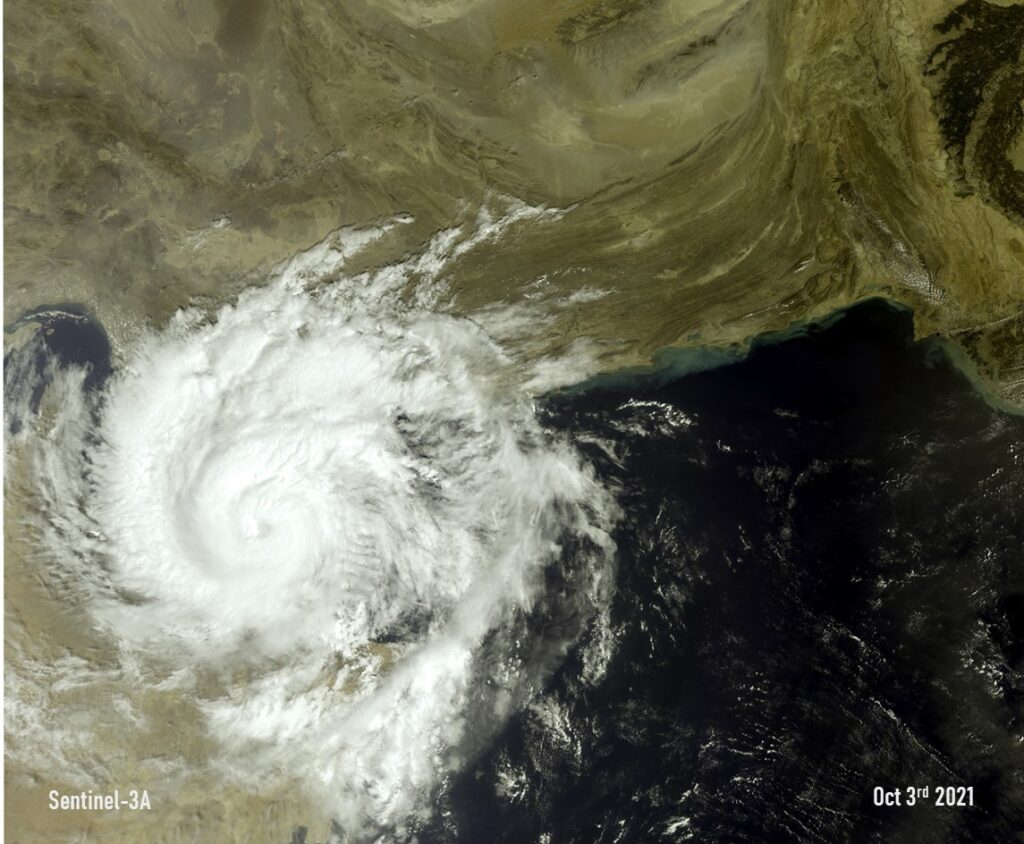
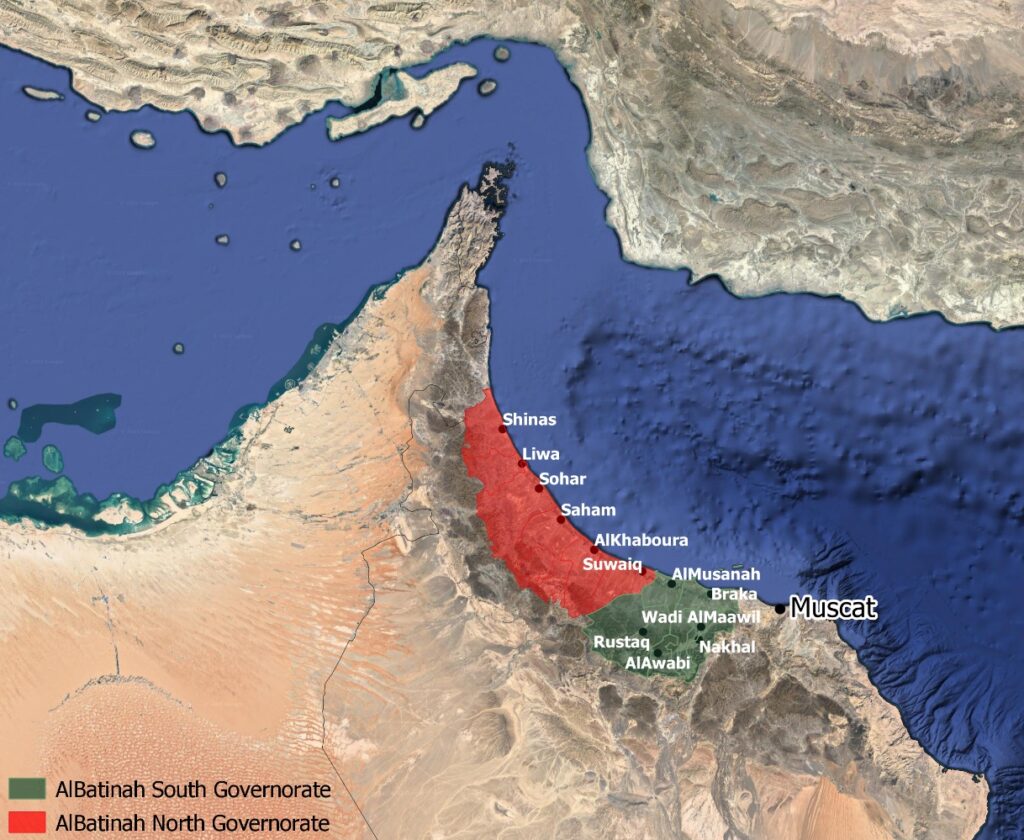
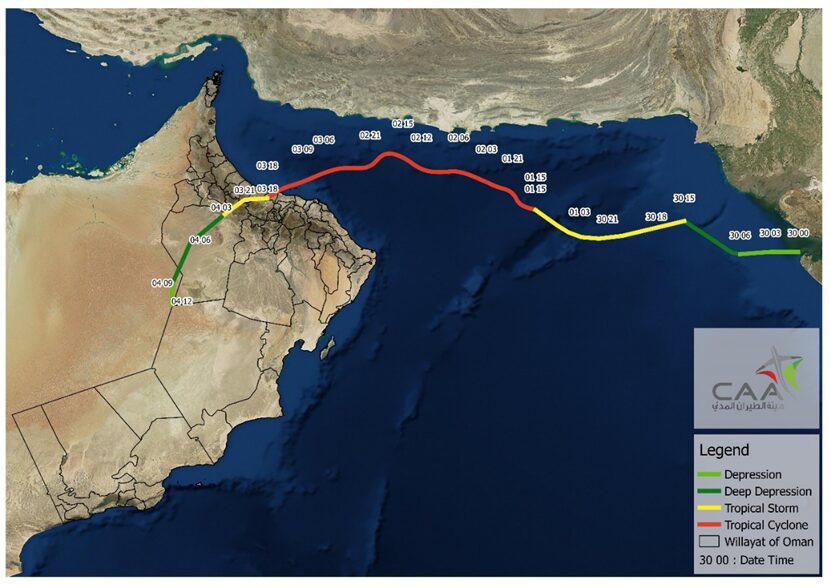
Shaheen made landfall on 3 October 2021 at around 16:00 UTC (20:00 local time) as a Category 1 cyclone on the coast of Al-Musannah (Figure 1), with sustained wind speeds of 75 knots (139 km/h) as recorded at Said Bin Sultan Naval Base.
The strongest winds and heaviest rainfall were in the northern part of the cyclone, so the greatest impact was in the area stretching from Al-Musannah to Sohar (Figure 1).
According to the National Committee for Emergency Management, 12 deaths were recorded due to flooding. In addition, widespread damage and destruction were reported to public and private property, including homes, farms, transportation infrastructure, as well as electricity and water networks.
The Omani National Multi-Hazard Early Warning Center, part of the Directorate General of Meteorology at the Civil Aviation Authority, issued 13 official statements and 49 tweets containing information, reports, alerts, and warnings during the period from 26 September to 4 October 2021.
Timeline of Cyclone Shaheen Events
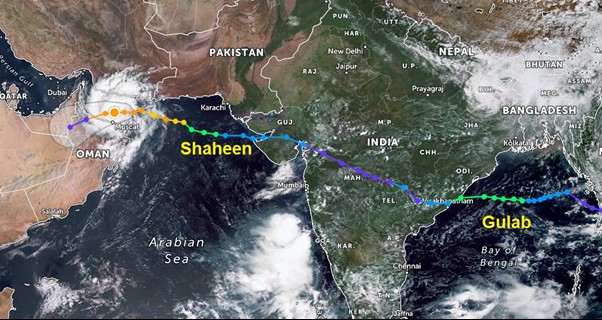
Cyclone Shaheen developed from the remnants of Tropical Cyclone “Gulab,” which had been active over the Bay of Bengal. Figure 2 shows the complete track from 24 September to 4 October 2021. The name “Gulab” was proposed by Pakistan and means “rose” in Urdu.
The Omani National Multi-Hazard Early Warning Center closely monitored the system from its early stage as a tropical depression over the Bay of Bengal, through its passage over Indian territory, its re-intensification over the Arabian Sea, and until it made landfall on the Al Batinah coast.
24 September: Early signs of Cyclone Shaheen appeared in medium-range forecast models.
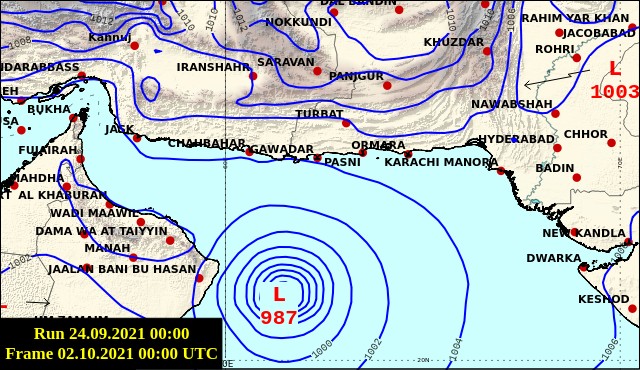
The first indication of a potential tropical system affecting Oman appeared in the 24 September 00 UTC update of the ECMWF (European Centre for Medium-Range Weather Forecasts) model, as shown in Figure 3. The model projected a tropical storm approaching South Al Sharqiyah Governorate on 2 October.
However, other global and local models in the 24 September updates did not predict this impact, or the available model charts did not cover that time range.
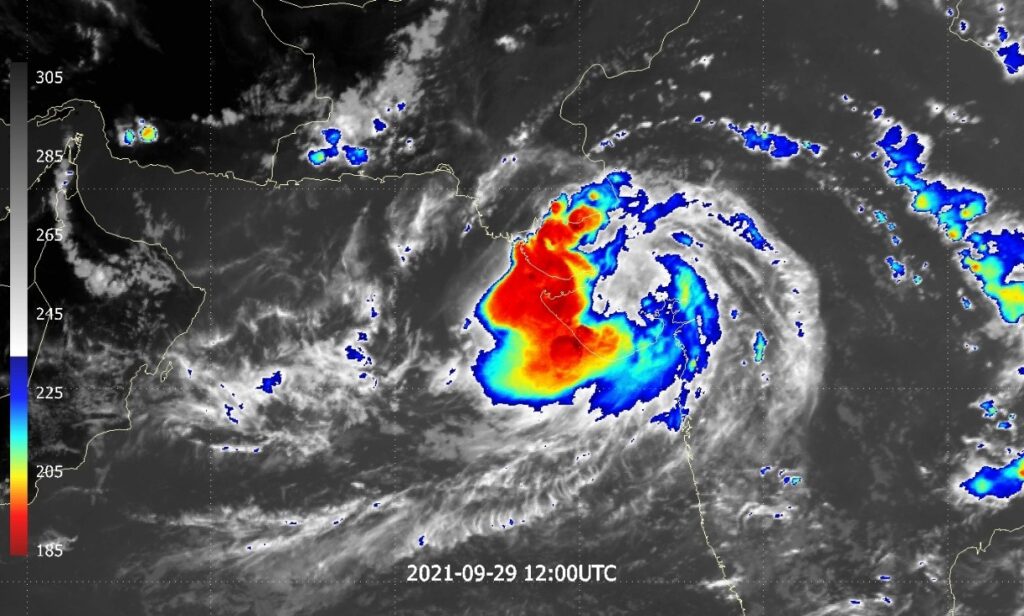
29 September: Early signs of Shaheen’s formation appeared.
On 29 September, the weather system entered the tropical maritime air mass over the Arabian Sea. The area of active convective cells expanded significantly west of the system’s center, with cloud top temperatures reaching -88°C (Figure 4).
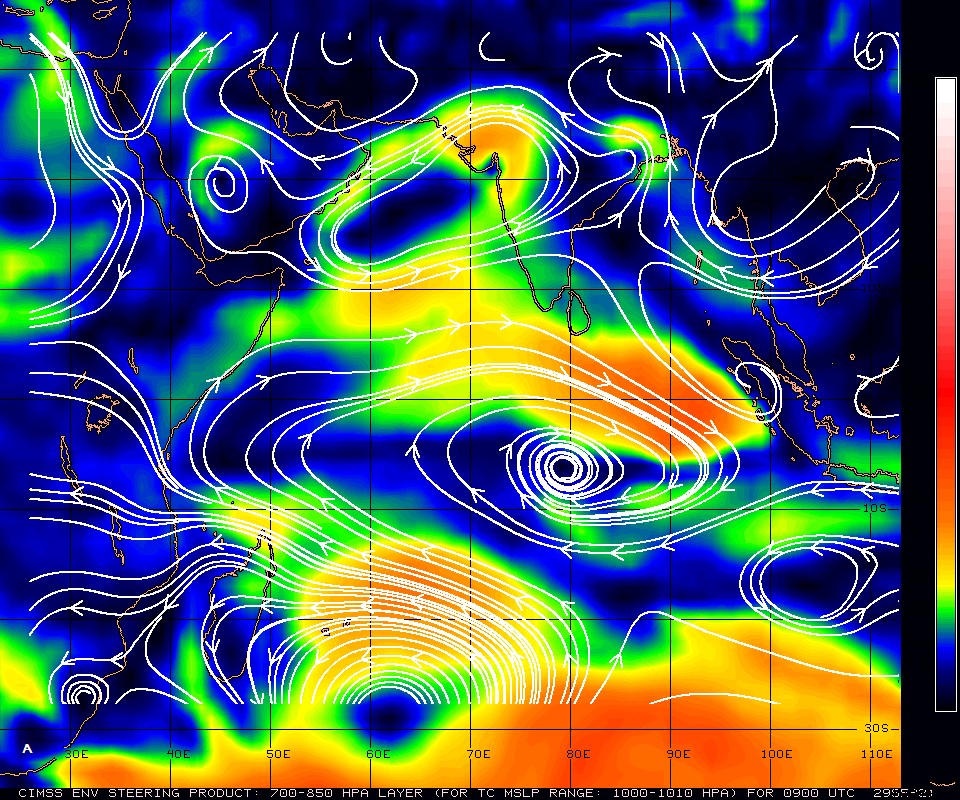
Mid-level steering winds between 700–850 hPa, as observed by satellite, indicated that the system’s path would be westward (Figure 5), even though the 28 September 00 UTC ECMWF update had predicted a northwestward track toward Pakistan.
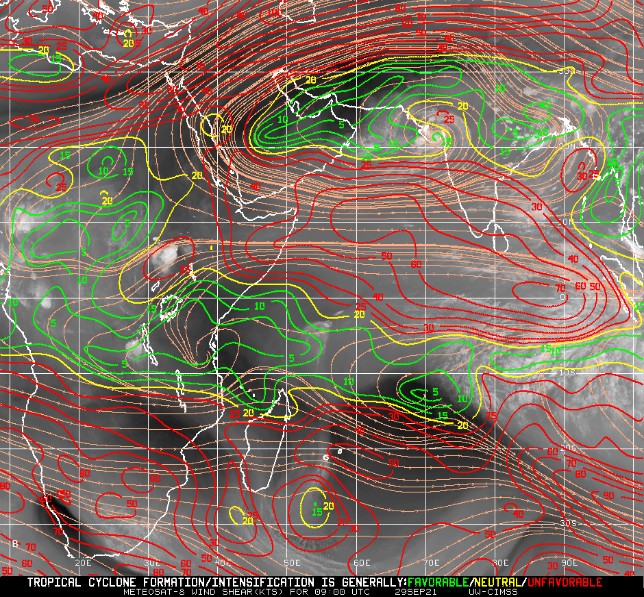
In addition, wind shear values on 29 September 2021 at 09:00 UTC (Figure 6) showed favorable conditions for further development.
30 September, 03:00 UTC: The system intensified into a deep depression.
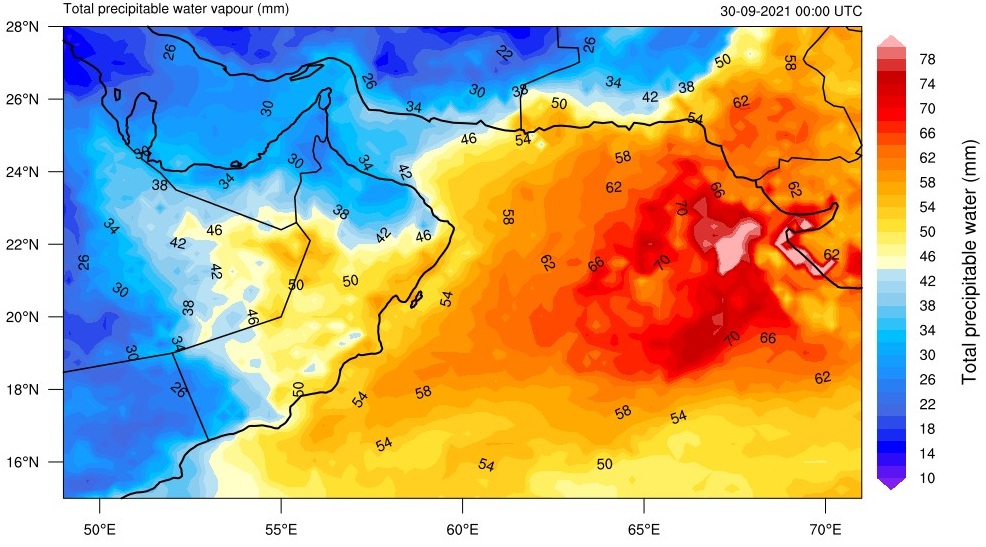
“Gulab” regained strength upon entering the tropical maritime air mass over the Arabian Sea. Several additional factors supported the intensification process—not only the high moisture available for condensation, as shown in Figure 7, but also: Strong upper-level divergence in the upper atmosphere, High sea surface temperatures & Weak wind shear.
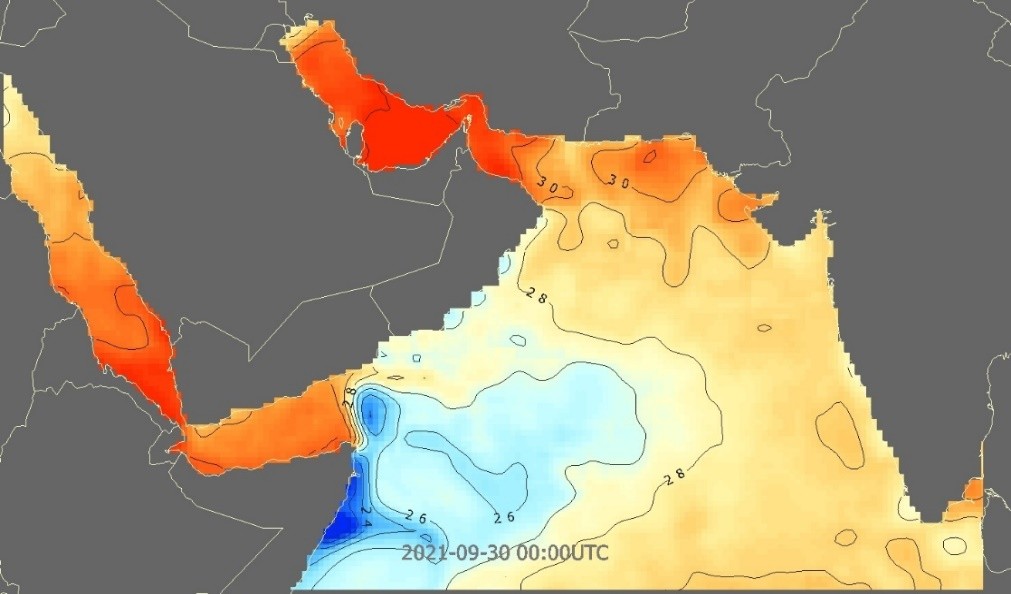
Reanalysis of sea surface temperature data by the U.S. National Oceanic and Atmospheric Administration (NOAA) on 30 September showed that the region where the cyclone formed had temperatures ranging between 30°C and 32°C (Figure 8), well above the minimum threshold for tropical cyclone formation, which is 26.5°C.
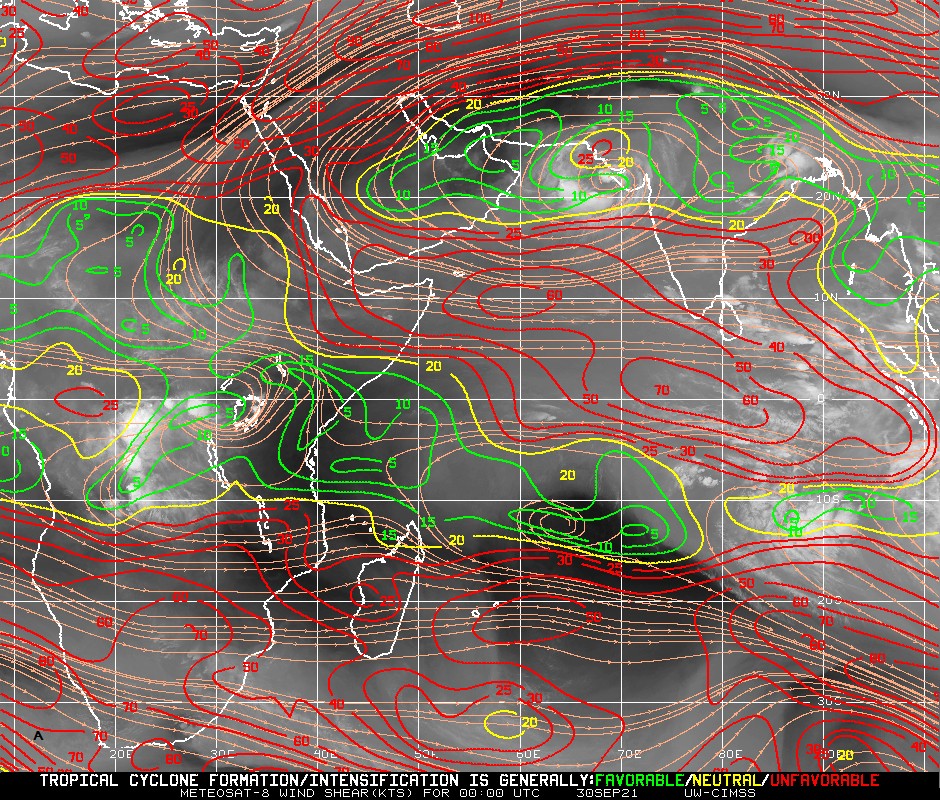
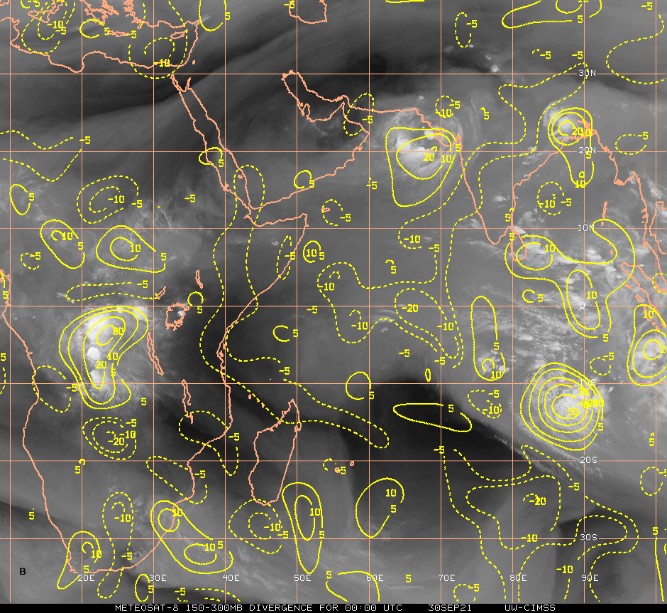
The region was also under light to moderate wind shear, ranging between 5 and 20 m/s (Figure 9), along with strong upper-level divergence in the upper atmosphere (Figure 10).
1 October: The system intensified into a Category 1 cyclone.
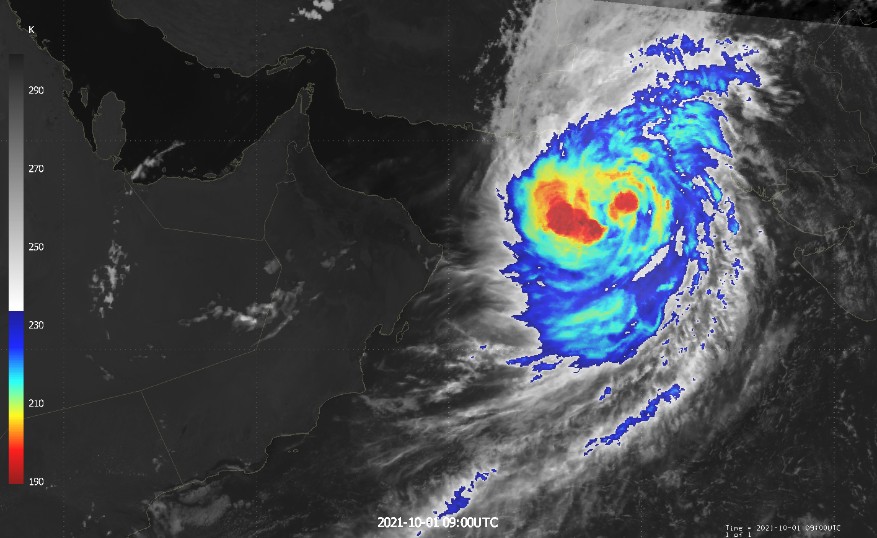
On Friday, 1 October, Tropical Storm Shaheen continued moving westward toward the Omani coast. Satellite imagery at 09:00 UTC (Figure 11) showed the storm’s center near latitude 23.3°N and longitude 64.4°E, approximately 650 km from Muscat. The nearest convective cloud bands associated with the storm were about 500 km from Muscat.
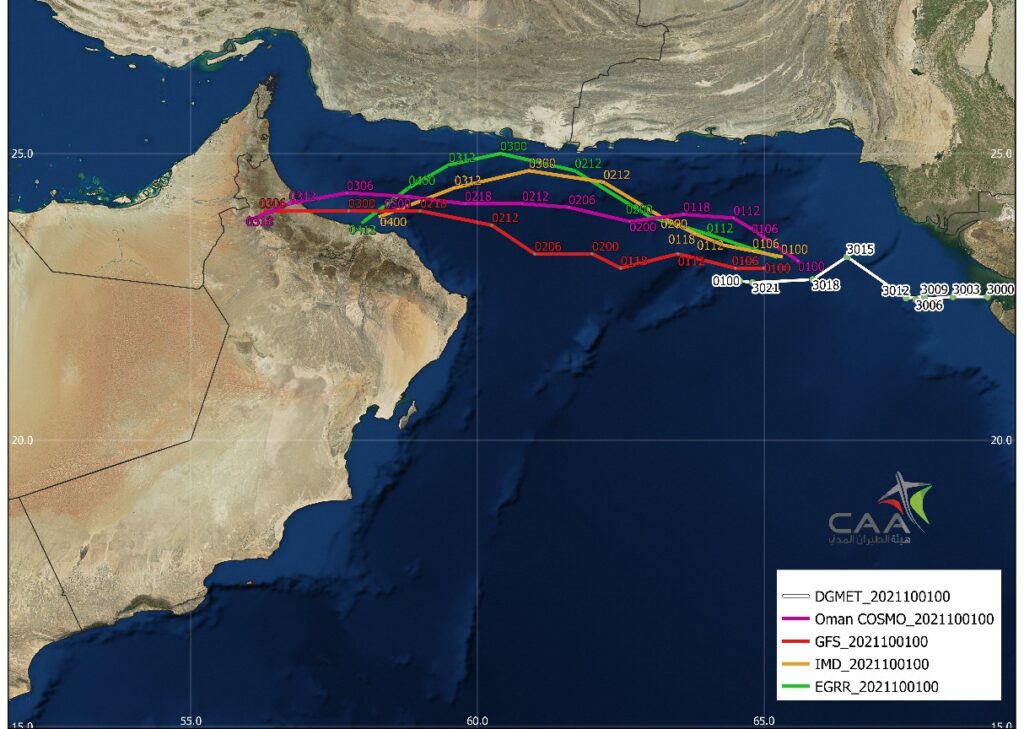
The 1 October 00 UTC update of global and regional models showed agreement on the storm intensifying into a Category 1 tropical cyclone within the next 24 hours. The models also agreed that the expected track of the cyclone would be westward toward the coastal areas from Muscat to the North Al Batinah governorates, as shown in Shaheen’s forecast track in Figure 12.
3 October, 16:00 UTC: Shaheen made landfall
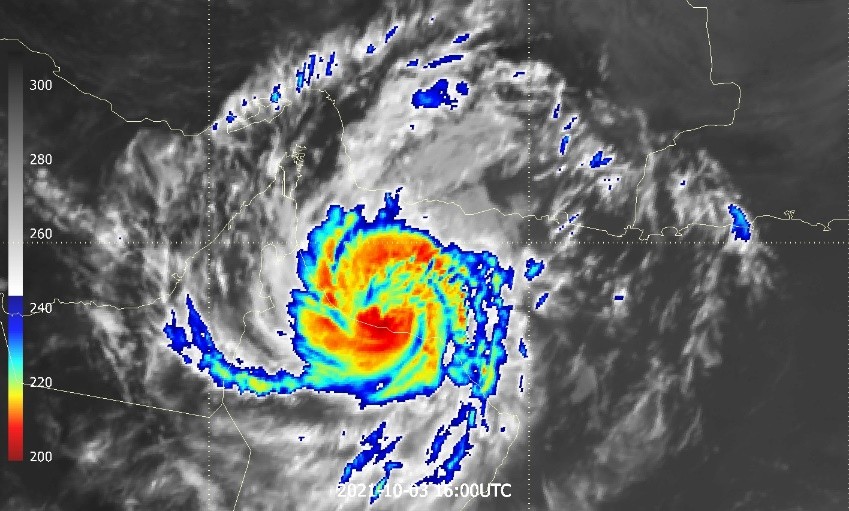
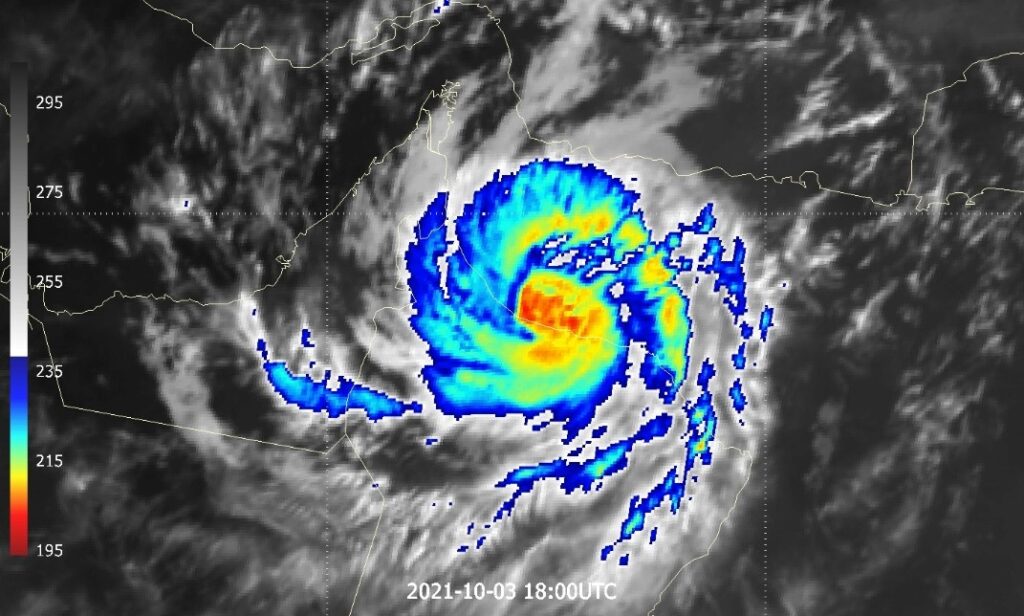
At 16:00 UTC, the center of Cyclone Shaheen made landfall on the coast of Al-Musannah. Wind speed at the cyclone’s center at landfall was recorded at around 75 knots, according to a report from a vessel near Al-Musannah.
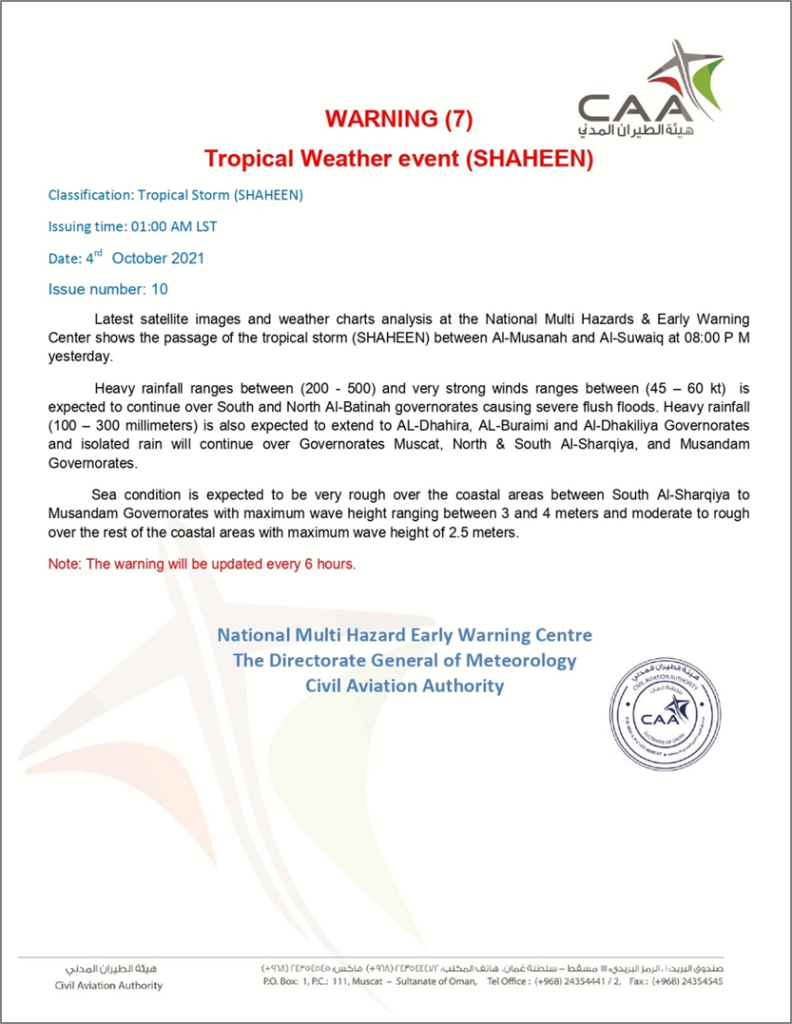
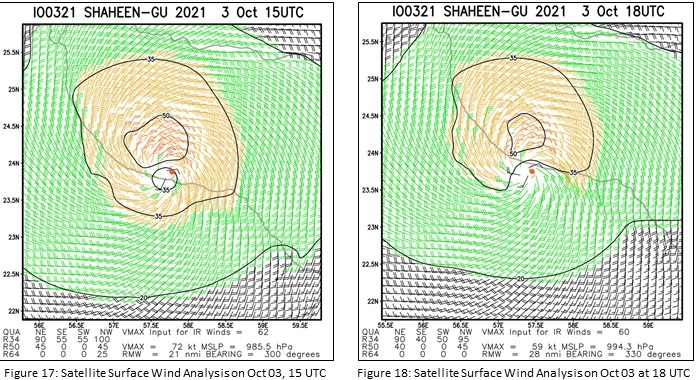
However, the cyclone’s center showed clear deformation, as seen in Figure 13, leading to some uncertainty about the exact time and location of landfall. Available estimates ranged between 15:00 and 18:00 UTC (07:00 to 10:00 local time), with Al-Musannah and Al-Suwaiq identified as possible landfall locations. This was also mentioned in Warning No. 7 issued by the National Multi-Hazard Early Warning Center (Annex 1).
The time and location of Shaheen’s landfall were confirmed only three days later, after evidence was gathered to pinpoint the time at 16:00 UTC and the location on the eastern coast of Al-Musannah near the Al-Suwadiyah area. The evidence included satellite data, eyewitness accounts, meteorological station observations, and field surveys.
Eyewitness Mahfouth Al-Saadi, who lives about 13 km southwest of the eastern coast of Al-Musannah, reported that northwesterly winds stopped around 17:15 UTC (21:15 local time), followed by a shift to southeasterly winds. This timing aligns with the landfall of Shaheen’s center on the eastern coast of Al-Musannah and matches the cyclone’s movement speed of 12 km/h.
Another eyewitness recorded a video nearly three hours later near the border between Al-Suwaiq and Al-Khaburah (MarkazAlAsifah, 2021).
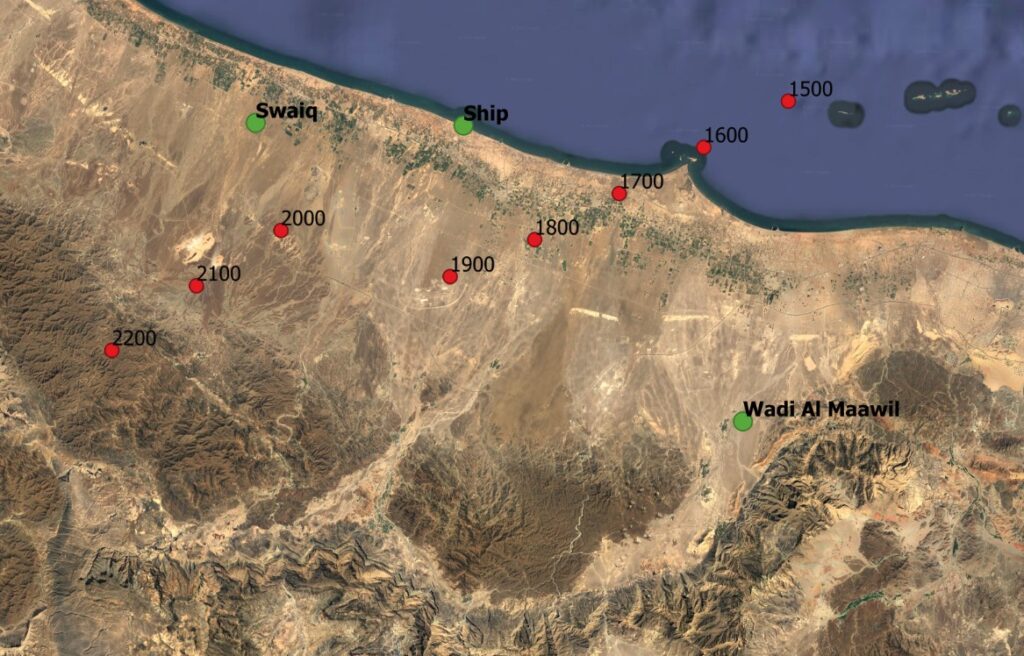
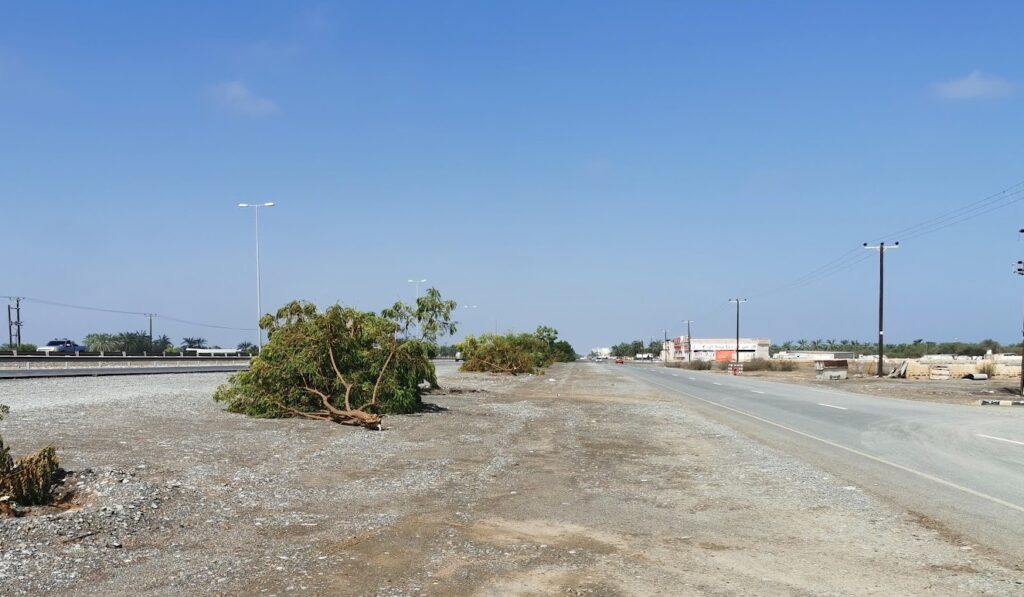
We visited the affected areas along the Sea of Oman coast on 6 October to look for ground evidence of Shaheen’s path and eye, such as the direction of fallen trees, damaged buildings, and other indicators. As shown in Figure 19, the direction of tree fall and building damage matched the earlier conclusion about Shaheen’s landfall location and track.
As the cyclone made landfall in Al-Musannah around 16:00 UTC, heavy rain and strong winds began in Al-Musannah and Al-Suwaiq, continuing into the next morning. The meteorological station in Al-Suwaiq recorded 55 mm of rainfall and wind gusts reaching 72 knots at 18:00 UTC (10:00 PM local time), during the impact of the cyclone’s eyewall, as shown in Figure 20.
Shortly after, heavy rain also began in Al-Khaburah, accompanied by strong winds. The intense rainfall from the cyclone’s eyewall caused flash floods that destroyed public and private property, including homes, roads, and trees.
Power outages began at 15:00 UTC (19:00 local time) in most parts of Al-Suwaiq, Al-Khaburah, and the southeastern areas of Saham. The outage continued in many affected areas for seven days.
3- Climate Statistics of Cyclone Shaheen
3.1 Rainfall Amounts
Hourly rainfall data from meteorological stations operated by the Directorate General of Meteorology and the Ministry of Agricultural, Fisheries and Water Resources were used to analyze rainfall amounts during Cyclone Shaheen.
The Al-Suwaiq station recorded the highest rainfall during Cyclone Shaheen on 3 and 4 October in North Al Batinah Governorate. The Muscat City station recorded the second highest rainfall during the period from 2 to 3 October.
The peak rainfall rate during Shaheen’s landfall was 76 mm per hour, recorded at the Al-Suwaiq station between 22:00 and 23:00 local time on 3 October.
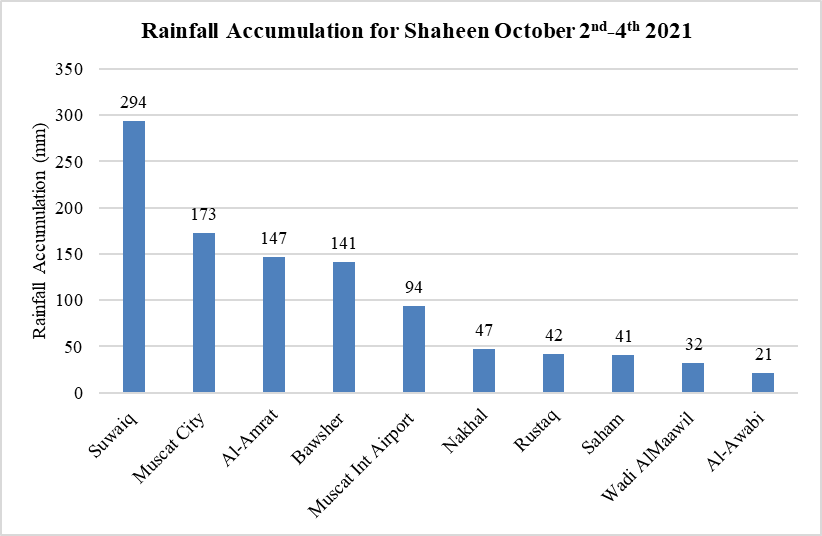
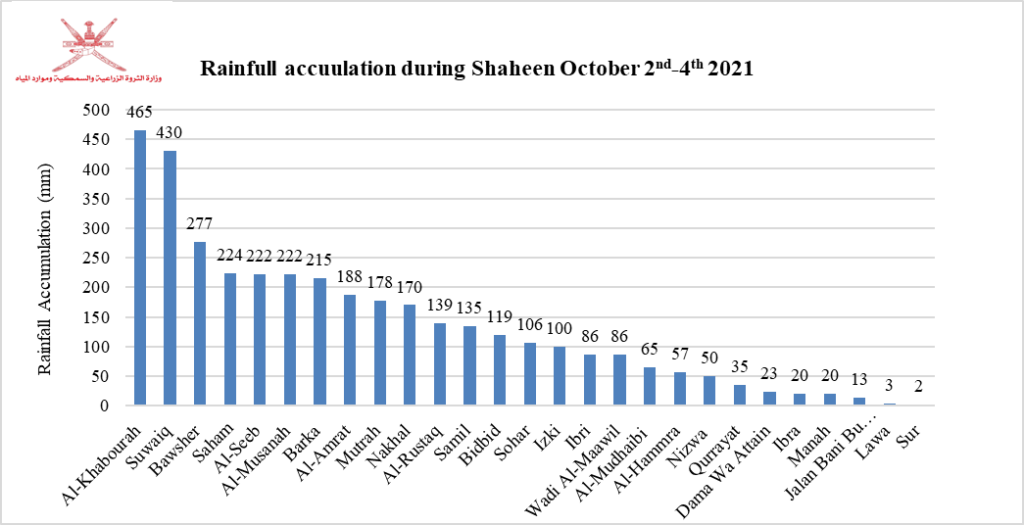
Figures 21 and 22 show the distribution of accumulated rainfall based on data from the Civil Aviation Authority’s meteorological station network and the rain gauge network of the Ministry of Agricultural, Fisheries and Water Resources.
The charts indicate that Al-Khaburah was the most affected area by Cyclone Shaheen, followed by Al-Suwaiq, then Bausher in Muscat Governorate, and finally Al-Musannah in South Al Batinah Governorate. This distribution clearly aligns with the earlier forecasts of the cyclone’s track.
Unfortunately, the meteorological stations in Al-Khaburah (23.9517°N, 57.0687°E) and Sultan Qaboos Port (23.627453°N, 58.572414°E) were flooded during Cyclone Shaheen, rendering their data unreliable for this event.
According to data from the Ministry of Agricultural, Fisheries and Water Resources, the highest cumulative rainfall during the cyclone was 465 mm at the Al-Khaburah station and 430 mm at the Al-Suwaiq station, as shown in Figure 22.
The highest rainfall rates during Cyclone Shaheen were recorded at the Al-Suwaiq station, reaching:76 mm/hour at 22:00 local time on 3 October 202155 mm/hour at 23:00 local time on the same day
The Muscat City station also recorded a high rainfall rate of 40.8 mm/hour at 03:00 AM local time on 3 October, as shown in Figure 23.
These rates reflect the intensity of rainfall caused by the passage of the cyclone’s eyewall. They are among the highest ever recorded during tropical systems in the Sultanate, explaining the rapid flooding and widespread damage in the affected areas.
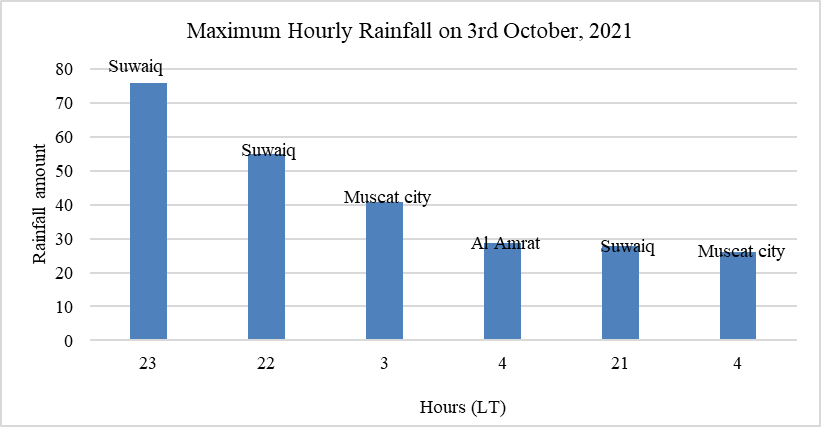
It is important to note that the hourly rainfall accumulation shown in Figure 23 is recorded separately for each hour. This means that peak rainfall intensity may span two consecutive hours, while the maximum accumulated amount is recorded under a single hour in the Oman Meteorology database.
Therefore, the recorded values represent accumulation within each separate Gregorian hour, but do not necessarily reflect the exact minute when peak rainfall occurred within that hour. This detail is essential when interpreting rainfall intensity and comparing it to field impacts.
Winds and Atmospheric Pressure During Cyclone Shaheen
The winds associated with Cyclone Shaheen caused widespread destruction of public and private property in the northern governorates of Oman, especially in North Al Batinah Governorate.
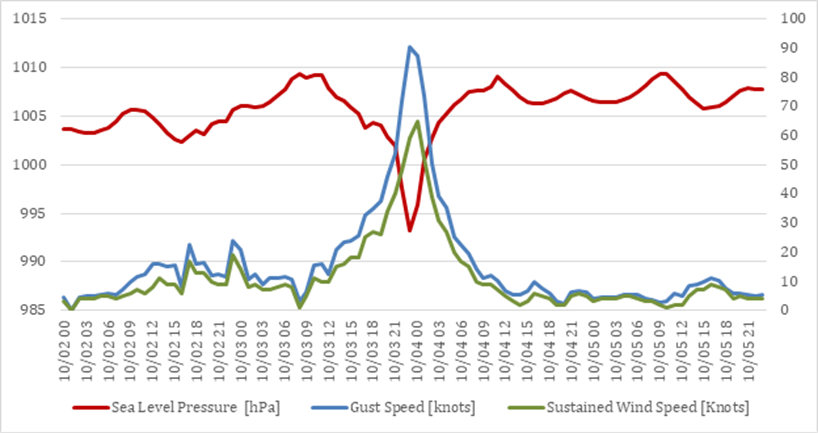
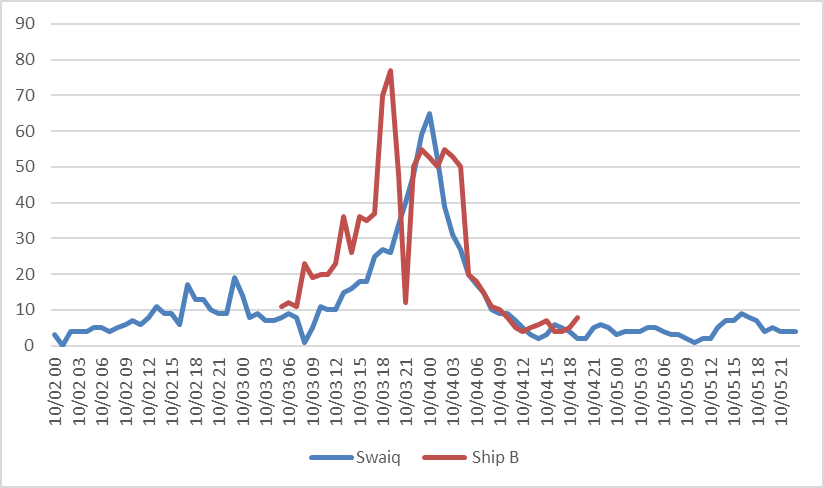
The Al-Suwaiq meteorological station, classified according to WMO standards, was the closest station to the center of Cyclone Shaheen approximately two hours after landfall. By that time, the system had weakened to a tropical storm as its center passed near the station.
The cyclone approached the Al-Suwaiq station from the southeast, with the closest distance between the cyclone’s eye and the station estimated at about 16 km.
The station recorded a maximum wind gust speed of 90 knots at 19:00 UTC (23:00 local time) on October 3, 2021.
.Figure 24 also shows significant changes in wind speed and atmospheric pressure at Al Suwaiq station during the cyclone’s passage.The lowest atmospheric pressure recorded was 988.7 hPa, coinciding with the maximum wind gust.
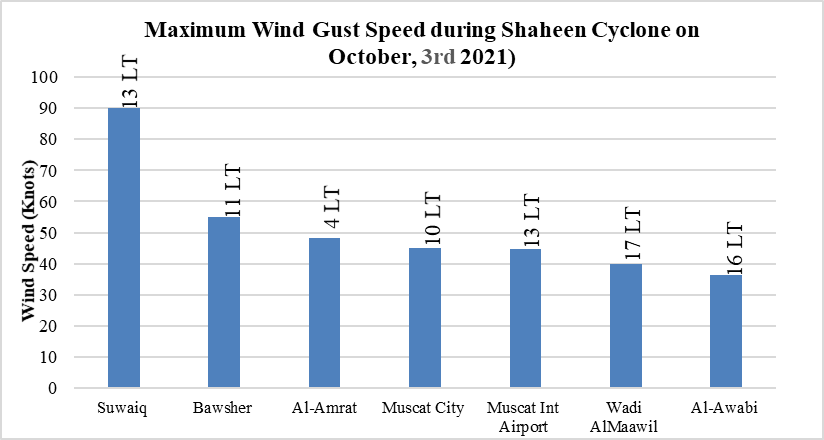
The second-highest wind gust was recorded at Bausher station, reaching 55.1 knots at 11:00 AM local time on October 3.
Figure 25 shows the maximum wind gust speeds recorded at various meteorological stations on October 3, illustrating the distribution of wind intensity across affected areas during Cyclone Shaheen’s passage.
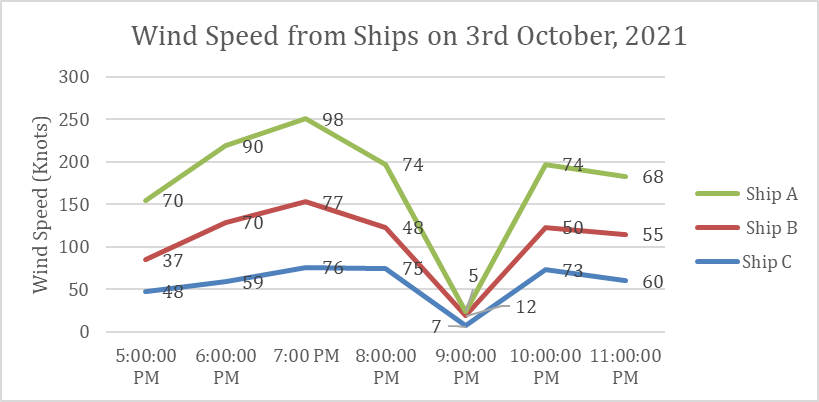
Based on available ship data from Said bin Sultan Naval Base at Wudam Al Sahil in Al Musannah, maximum wind speeds were recorded at 15:00 UTC (19:00 local time) as follows: Ship A: 98 knots, Ship B: 77 knots & Ship C: 76 knots.
These peak values were followed by a sudden decrease in wind speed of more than 60 knots over the next two hours, as shown in Figure 27.
This lull in wind indicates the passage of Cyclone Shaheen’s eye over the base from the east around 21:00 local time, clearly marking the cyclone’s center proximity at that moment.
during Shaheen cyclone Oct 3, 2021
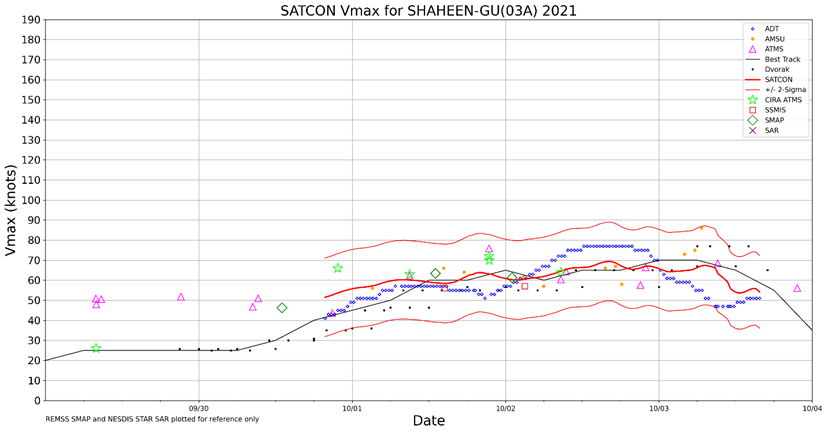
Figure 28 displays satellite-based estimates compiled from multiple satellites using the Satellite Consensus Intensity Estimate tool by UM-CIMSS.
These estimates show good agreement with actual sustained wind measurements when considering the potential margin of error. This consistency reinforces the reliability of satellite data in tracking Cyclone Shaheen’s intensity and monitoring its development as it approached Oman’s coast.
The actual track of Cyclone Shaheen:
Plotting the best track of any tropical cyclone is a lengthy and ongoing process. The track line is continually updated as datasets undergo analysis and reanalysis. Cyclone Shaheen was no exception—it went through various stages including formation, intensification, weakening, and dissipation.
The main methods used to plot Shaheen’s best track relied primarily on satellite images and their products. However, after Shaheen made landfall, field verification was done using data from observation stations and field visits.
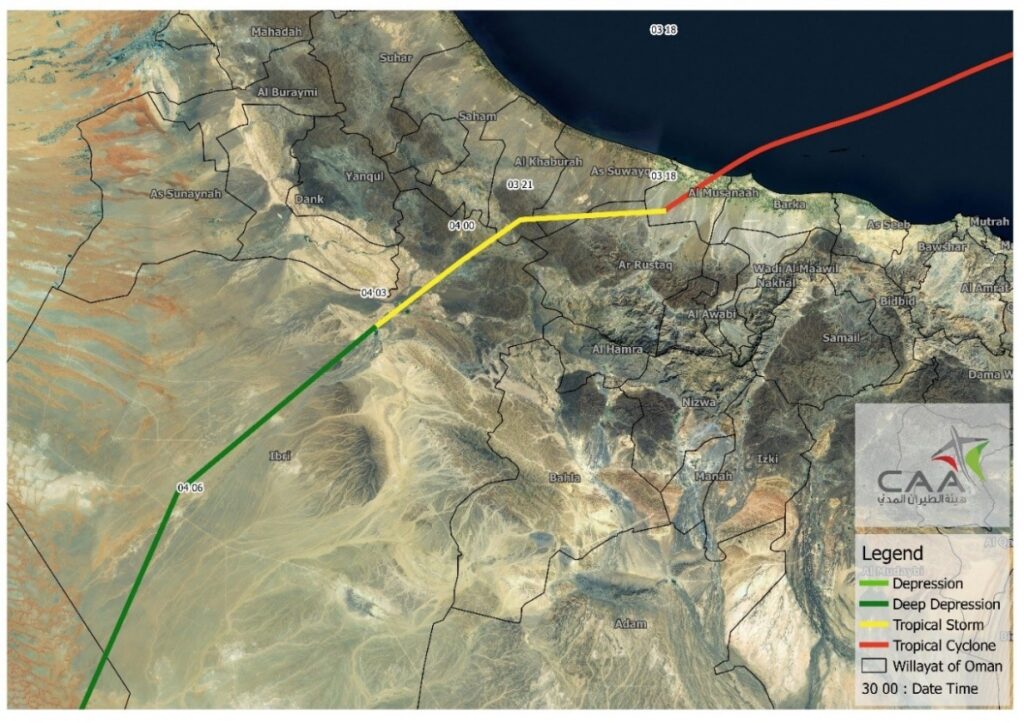
Figure 29 shows the best track of Cyclone Shaheen, while Figure 30 focuses on the cyclone’s landfall area.
References
@OmanMeteorology-05:59 PM · Sep 30. (2021). Shaheen Update – Oman Directorate General of Meteorology. https://twitter.com/OmanMeteorology/status/1443576348186865668
@OmanMeteorology-11:16 AM · Sep 29. (2021). Shaheen Update – Oman Directorate General of Meteorology. https://twitter.com/OmanMeteorology/status/1443112373309616130
@OmanMeteorology-7:23 PM · Sep 30. (2021). Shaheen Update – Oman Directorate General of Meteorology. https://twitter.com/OmanMeteorology/status/1443597446932746247
@OmanMeteorology-8:18 AM · Oct 1. (2021). Shaheen Update – Oman Directorate General of Meteorology. https://twitter.com/OmanMeteorology/status/1443792490486812673
@OmanMeteorology-8:36·Sep.26. (2021). Shaheen Update – Oman Directorate General of Meteorology. https://twitter.com/OmanMeteorology/status/1441985022957817858
@OmanMeteorology-9:16·Sep.27. (2021). Shaheen Update – Oman Directorate General of Meteorology. https://twitter.com/OmanMeteorology/status/1442357501932892166
Blount, C., Fritz, A. H. M., & AlHarthy, A. (2010). Coastal Vulnerability Assessment Based on Historic Tropical Cyclones in the Arabian Sea. ResearchGate. https://www.researchgate.net/publication/263847585_Coastal_Vulnerability_Assessment_Based_on_Historic_Tropical_Cyclones_in_the_Arabian_Sea
MarkazAlAsifah. (2021). Markaz AlAsifah in Shaheen – YouTube. https://youtu.be/33aF6RihtG4?t=517
Membery, D. (2002). Monsoon tropical cyclones: Part 2. Weather, 57(7), 246–255. https://doi.org/10.1256/004316502760195911
Mullan, B., Salinger, M., Thompson, C., Ramsay, D., & Wild, M. (2021). Chatham Islands Climate Change.
Observer. (2021). Aftermath of cyclone Shaheen in oman. https://www.omanobserver.om/article/1107629/oman/weather/photo-slideshow-aftermath-of-cyclone-shaheen-in-oman
RAMMB. (2021). NOAA Regional and Mesoscale Meteorology Branch: TC Real-Time: IO032021 – Tropical Cyclone (>64 kt) SHAHEEN-GU. http://rammb-data.cira.colostate.edu/tc_realtime/storm.asp?storm_identifier=io032021
Times of Oman. (2021). Cyclone Shaheen: Oman’s Ministerial Committee holds first meeting. https://timesofoman.com/article/107585-cyclone-shaheen-omans-ministerial-committee-holds-first-meeting
WMO. (2020). Tropical Cyclone Operational Plans for the Bay of Bengal and Arabian Sea | WMO Report No. TCP-21. https://community.wmo.int/tropical-cyclone-operational-plans
Zoom-Earth. (2021). Cyclonic Storm Shaheen-Gulab 2021. https://zoom.earth/storms/shaheen-gulab-2021/#layers=daily
Appendices:
Warning No. 7